Troubleshooting a feedback signals like SSI or magnetostrictive Start/Stop or PWM (MDT) is a common problem. These signals are high-speed digital signals, which require an oscilloscope to view. However, it can be difficult to get an oscilloscope at a job site.
Fortunately, with the RMC200 S8 and U14 modules, it is possible to create an oscilloscope-like trace of these signals in the Plot Manager. This can be used for SSI Clock and Data signals, and for MDT Interrogate and Return signals.
A real oscilloscope captures data at a high rate, such as hundreds of megahertz, with sample periods in the microseconds or nanoseconds. The RMC plots can only capture data every loop time, which is typically 1 millisecond; much too slow to capture all the SSI or MDT data that occurs within that loop time.
In order to capture the SSI or MDT data that occurs within the loop time, the S8 and U14 do the following:
- In one loop time, capture a sample at the beginning of the loop time.
- In the next loop time, capture a sample at a point 200 ns later in the loop time.
- In the next loop time, capture a sample at a point 200 ns later (at 400 ns) in the loop time.
- Continue until reaching the end of the loop time.
By plotting all these samples, a picture of the signal emerges. In order for this to work, the SSI or MDT signals must not be changing during this process. In electrical engineering, this technique is referred to as equivalent-time sampling.
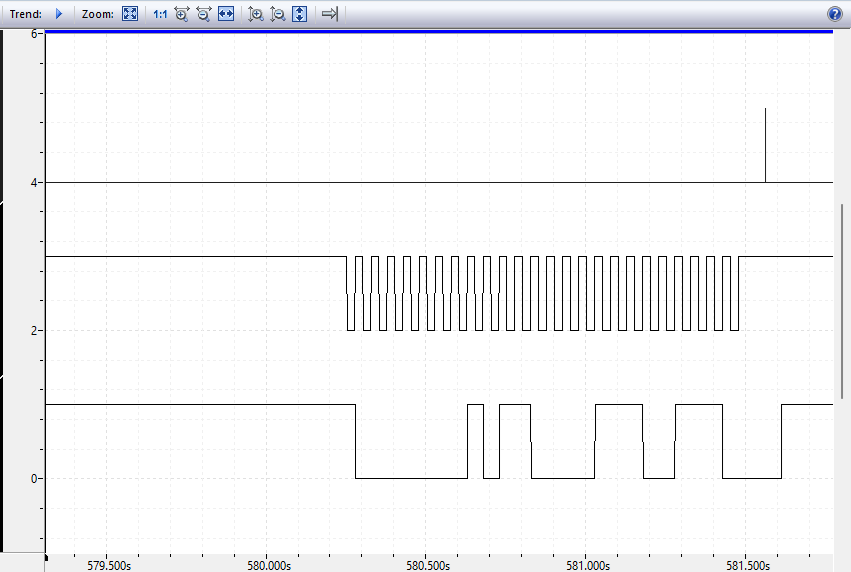
The attached RMCTools project file demonstrates how to create an oscilloscope-like trace of the SSI Clock and Data signals in the Plot Manager. It also includes the Loop Tick, which indicates the start of each loop time in the RMC. One full SSI transmission occurs in each loop time, so it is helpful to include the loop tick to better understand the Clock and Data signals. Notice that the SSI data transmission occurs toward the end of the loop time, so the Loop Tick will be high shortly after the SSI transmission.
In the attached RMCTools project, the SSI_MDT_Scope User Program extracts the Clock (bit 15), Data (bit 14), and Loop Tick (bit 16) data from the Transducer Status A axis status register and assigns them to variables that are then included in the Plot template.
For easy viewing, the SSI_MDT_Scope User Program assigns the Data bit to values 0 and 1, the Clock bits to 2 and 3, and the Loop Tick bits to 4 and 5. This spaces the lines vertically from each other.
To use this example:
- Export the user program from this example project and import it into your RMCTools project (right-click User Programs and select Import or Export). This will add the program and the required variables to your project.
- In the Plot Template Editor, copy the Scope_Plot template, then paste it into your RMCTools project. You might to correct the register addresses to the variables if the variables get reassigned during the import. Note that the variable names will be correct, but the addresses may not.
- In the user program, edit the axis number (_Axis[0]) in three locations to the axis it needs to apply to.
- Start trending the plot.
- Start the user program.
Notes:
-
Make sure the SSI or MDT data is not changing during this process (axis isn’t moving). For high resolution sensors, this can be challenging, but if the lowest bit or two of the position changes, that usually doesn’t cause any problems.
-
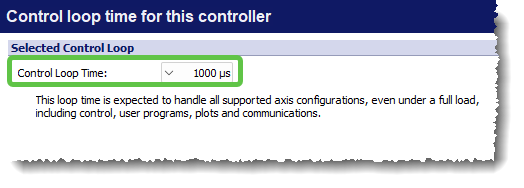
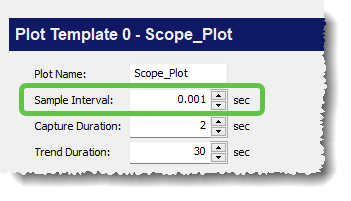
Make sure to set the Plot Sample Interval to the same as the RMC Loop Time. If these are set differently, the plotted waveform will have missing information.
- This captures only the boolean data of the signals after the physical signal has been received by the RMC and interpreted as zero or one. It does not provide visibility into what the physical signals look like, which would require a real oscilloscope.
ScopeExample.rmcproj (12.3 KB)


