Hello everyone,
We are developing an HMI using LabVIEW for a test machine with numerous sensors. Our goal is to visualize the sensor data as plots within the HMI. However, we want to make the visualization feature customizable, allowing users to select which sensors’ data to display on the plots.
I’ve researched this but encountered a limitation: the plot area register seems to be non-writable. Is there a way to implement this functionality in LabVIEW? Could you please help me about this issue?
The plot configuration registers that specify the plot data to read are Read/Write. You should be able to write to this area the register addresses of the items you wish to plot.
RMCTools doesn’t play with this nicely, and you won’t be able to use that plot in the Plot Manager, but you should get the desired data in the plots that you read via LabVIEW.
For example, for RMC200 plot 0, use register %MD512.16 to define plot quantity 0, %MD512.17 to define plot quantity 1, etc.
The addresses are listed here: https://deltamotion.com/support/webhelp/rmctools/#Registers/RMC200_Register_Map/RMC200_RegMap_512-543_PlotConfig.htm
If it still isn’t working, let me know which exactly which registers and values you are writing and the behavior you are seeing.
-Jacob
Hi Jacob,
Thanks for you quick answer. Actually I didnt know that and i try it. When i try your suggestion, my plot stoped and showed an error.
Yes, that is expected. If you directly write to the plot configuration registers that specify the plot data to read and write, then it is best to not try to use that plot template in RMCTools.
Hi Jacob,
Sorry for my late answer. I also try these “For example, for RMC200 plot 0, use register %MD512.16 to define plot quantity 0, %MD512.17 to define plot quantity 1, etc.”. I couldnt do it. Could you please share an basic example about it. Is there any picture or code file about it? Maybe I missed something.
Did you try reading the plot from LabVIEW after you changed the registers? You will not be able to read it from RMCTools.
Here is an example: Configure the RMC200 Plot Template 0 have two items: Axis 0 Actual Position and Axis 0 Velocity.
Here is how to do it:
-
Write the address of Axis 0 Actual Position to the Plot 0 quantity 0 configuration registers, which is address %MD512.16.
The address of Actual 0 Actual Position is %MD256.20. The value 256 needs to be written to bits 12-23 of %MD512.16 and the value 20 needs to be written to bits 0-11 of %MD512.16. This is the same as calculating 256*4096 + 20 = 1,048,596, and writing 1,048,596 to the entire register %MD512.16.
-
Write the address of Axis 0 Actual Velocity to Plot 0 quantity 0, which is address %MD512.17. The address of Actual 0 Actual Velocity is %MD256.21. The value 256 needs to be written to bits 12-23 of %MD512.17 and the value 21 needs to be written to bits 0-11 of %MD512.17. This is the same as calculating 256*4096 + 20 = 1,048,597, and writing 1,048,597 to the entire register %MD512.17.
Now when you start plot 0, then read it, you should get the Axis 0 Actual Position and Actual Velocity data.
-Jacob
Yes, i did. I couldn’t read it.
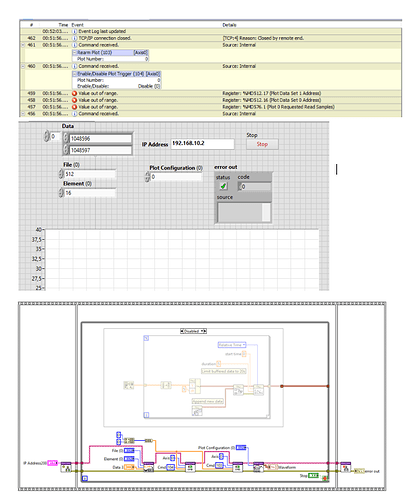
I tried your example and I receive these errors (out of range). Below here is the image about my project. Is there any wrong that i made? If you need more information about my project, I can share.
Hmm… that all looks correct. Did you write the values as floats or integers? The should be integers. The uploaded image is too low of a resolution to tell by looking at the screenshot.
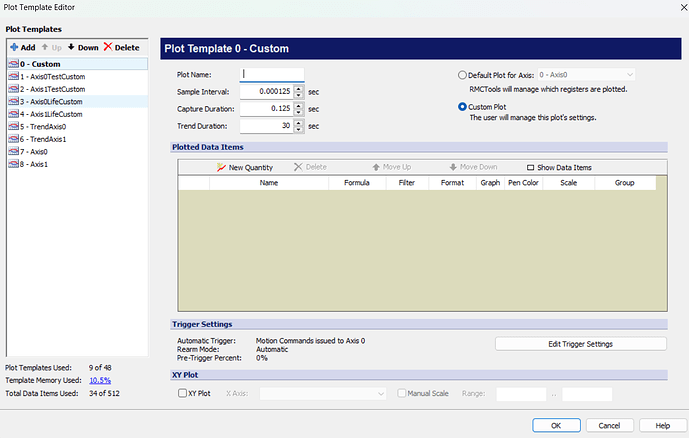
I wrote integers. It is not working. But its about plot configuration i think. But i dont want to configure these datasets from plot template editor, I wanted to do that with LabVIEW. Sorry for the image resolution. When i upload the images, my trustworty level was not enough to more than one images uploading for discussion forum. Can be the problem about plot template or not?
I created a vi similiar to yours and it worked for me. Would you be able to email your vi to support@deltamotion.com so I can take a closer look at it? If that doesn’t work, can you post a screenshot of just the Block Diagram so it ends up clearer?
Thanks for sending in the vi to support@deltamotion.com. I replaced this VI with Write Integers instead of Write Floats. I also changed Data 3 to be a 32-bit integer. After these changes, the VI works as expect.
When i write these number I can read perfectly but when i change the adreesses like the second photo I read still same value. When I change the values, I expected read first plot as velocity second plot as position. But I couldnt. Is there any wrong thing? Can you try it like I did?
Those numbers are hexadecimal (I made the same mistake). You’ll need to change the display format in LabVIEW so that it is not hexadecimal (which is indicated by the “x” at the beginning of the input box).
If you look at the event log, I’m guessing that neither of those values was accepted.
Sorry for late response. Could you please send us your rmc code and your vi?
Attached is the VI example code. This example communicates with the online RMC200 so you should be able to run it as is.
Delta RMC200 Simple Plot Example.zip (15.0 KB)
The RMC project used does not matter. But I linked the project used anyway.
RMC200.rmcproj (39.5 KB)
Okey, thank you Paul. I will try and let you know the results.
Thank you so much Paul, we try it. And it works  !! Have a nice day.


