The RMCTools help topic Valve Linearization is a great resource for creating valve linearization curves.
One additional tool that I’ve found to be helpful is Web Plot Digitizer. This is a web-based application that allows you to upload an image, set the origin, and then create x,y points.
Another option is PlotDigitizer Online App. Web Plot Digitizer now requires an account to use.
Steps to create the curve.
-
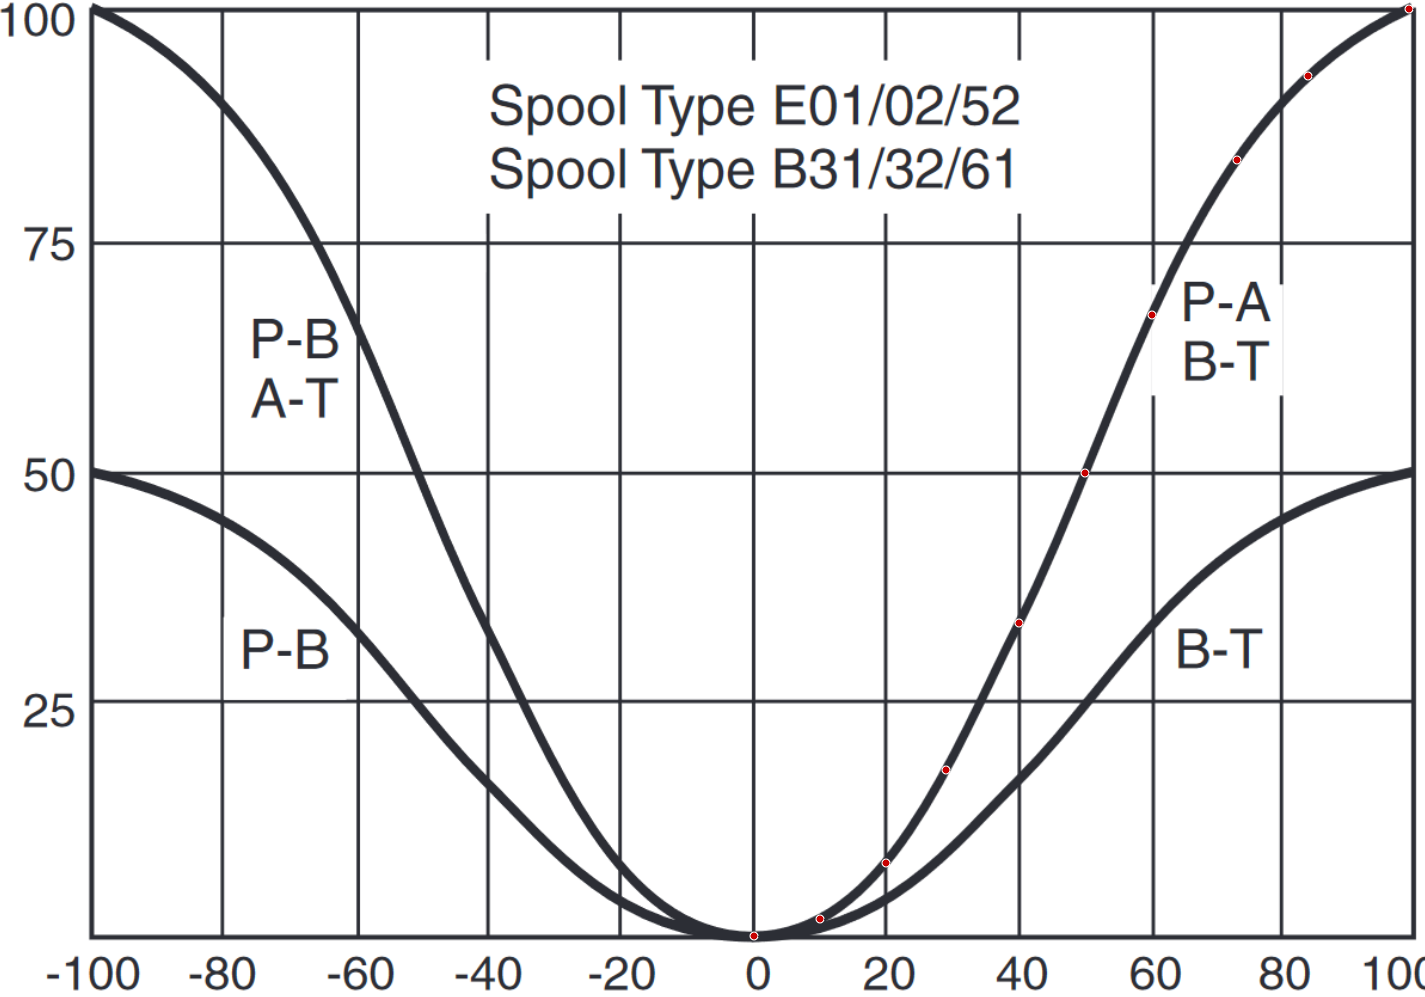
Upload an image of the Valve Flow vs Input Signal to Web Plot Digitizer as a 2D (X-Y) Plot.
-
Select Align Axes and follow the steps.
-
Manually add points to the half of the curve as shown in the below chart.
-
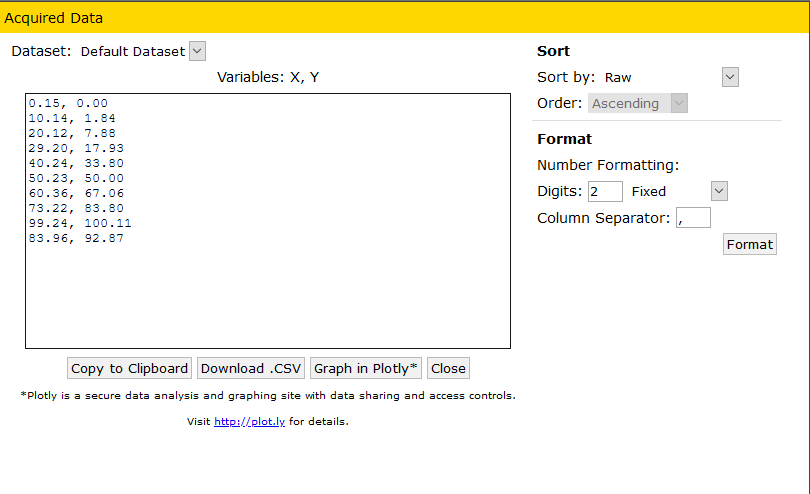
View the data and export it as a CSV file (raw data shown below).
-
Open the CSV file in Excel.
-
Use Excel to create the other half of the curve. You will need to take the X and Y points on the positive side of the curve and multiply them by -1.
-
Copy the Excel data, and paste it into the Curve Tool.
-
If you have two points at 0, delete one of the points. Typically, the point around 0 will be 0,0.
-
Set the endpoint behavior to natural velocity.
-
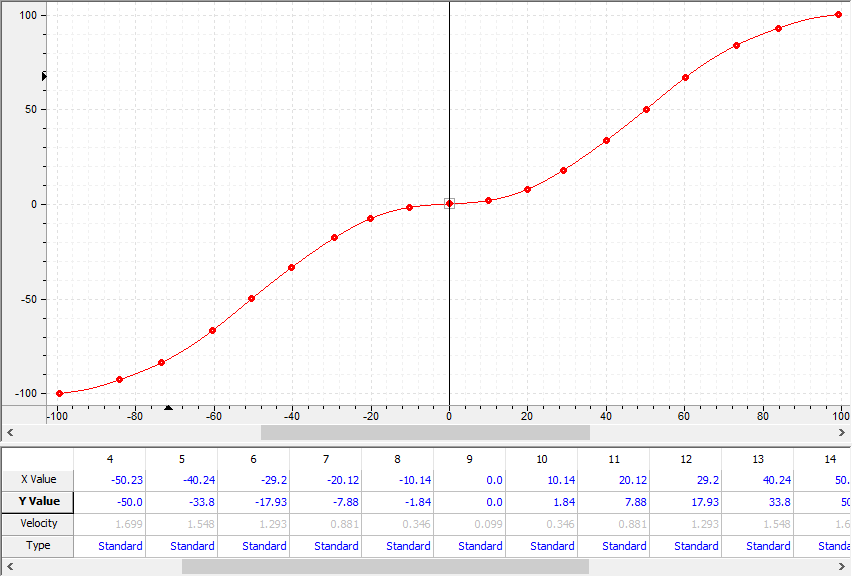
The complete curve should look similar to below.