Papajorgio,
To answer your question precisely, could you specify exactly which charts are you referring to? Some charts refer to P-A and B-T, some to A-B, and some to P-T.
I think perhaps there is some confusion as to the different situations. In a typical industrial hydraulic system used for high-performance motion control, the HPU supplies a constant pressure, regardless of the flow (up to a certain max flow, of course). The supply and demand of the system is sized such that constant pressure (within some tolerance) can always be maintained. The valves are closed-center valves. The HPU is either pressure-compensated, or a relief valve is used.
Typical mobile hydraulics are different. The pump is always pumping, and the valves are open-center. When the valves are open, supply pressure is very low. Pressure is built when the valves begin to close. This seems to be what you are referring to with the statement “in all other cases max pump pressure would be only load pressure + any pressure drops in the system”.
Our world of high-performance motion control deals only with a constant-pressure system. We are not interested in open-center systems, as they can’t provide as good control.
I suspect that when specs are given in terms of P-T, it simply means just that - the pressure drop between P and T. In a constant-pressure system, it won’t vary much. In open-center systems, it will.
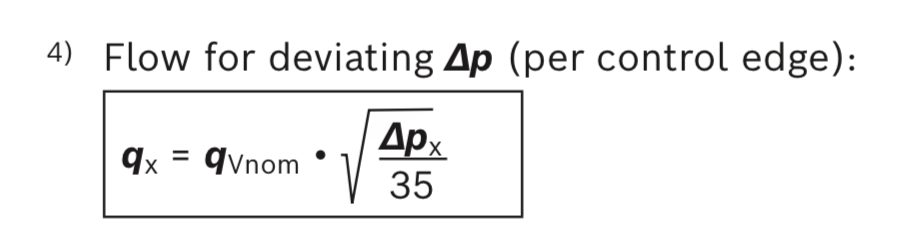
Perhaps some of the charts you refer to are performance limit charts, which I believe usually list P-T. Mainly, the performance limits are simply the formula of flow vs. pressure drop. This applies individually to the P-A and P-T, because, as you indicate, they can be different if a load exists. However, in valve datasheets, the performance specs are usually listed as tested with A directly connected to B. In this case, the pressure drops between A and B are equal if the spool is symmetrical, so the full P-T gives a good an idea of the performance limit.
Even in open-center systems, when we talk about the performance limit of a valve, the Bernoulli forces can overcome the spool, and flow may be reduced so that the limiting factor is not the normal flow vs. pressure drop formula. In this case, I believe the individual P-A and B-T flows and pressure drops are individually important, but my guess is that test cases imply equal flows and drops for simplicity of understanding and comparing between valves.
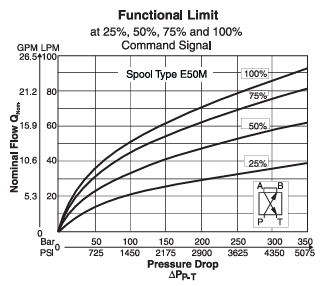
To illustrate, here is a performance chart of a Parker D1FP, which has a powerful linear motor that does not have significant impact by Bernoulli flow forces:
You can see the small hydraulic diagram shows that A and B are connected, so pressure drops are equal.
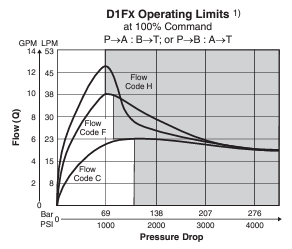
Here is a performance chart of a Parker D1FX, which has weak solenoids that do have significant impact by Bernoulli flow forces:
This chart does not show the hydraulic diagram of the test conditions, but I suspect that A and B are connected, so pressure drops are equal. You can see in this chart that after some point, as pressure increases, the flow decreases, which is problematic for motion controllers.