To find the third point in a flat plane when you know the locations of two points and the lengths of the lines connecting them to the third, you are essentially solving for the intersection of two circles.
The Setup
Let’s define our known values:
-
Point A: (x_1, y_1)
-
Point B: (x_2, y_2)
-
Line length from A (r_1): The radius of the first circle.
-
Line length from B (r_2): The radius of the second circle.
The Step-by-Step Calculation
To find the third point (x, y), we use the distance formula for both points, resulting in a system of two quadratic equations:
-
(x - x_1)^2 + (y - y_1)^2 = r_1^2
-
(x - x_2)^2 + (y - y_2)^2 = r_2^2
1. Find the distance between the two known points (d)
First, calculate the straight-line distance between Point A and Point B:
- Note: If d > r_1 + r_2, the lines are too short to meet, and no third point exists. If d < |r_1 - r_2|, one point is inside the other’s circle and they don’t touch.
2. Find the distance from Point A to the “centerline” (a)
Imagine a line connecting A and B. We need to find the distance a from Point A to the point where the two circles’ intersection aligns:
3. Find the height (h)
Now, find the perpendicular distance from the line AB to the third point:
4. Calculate the coordinates of the third point
In most cases, there are two possible locations for the third point (one on either side of the line connecting A and B).
First, find the point (x_0, y_0) which is the point on line AB at distance a from Point A:
Finally, use h to offset from (x_0, y_0) to get your two possible third points:
Summary of Results
-
Two Solutions: Usually, the lines can form a triangle in two directions (e.g., “up” or “down”).
-
One Solution: If r_1 + r_2 = d, the circles touch at exactly one point on the line between A and B.
-
No Solution: If the lengths provided are physically impossible to connect.
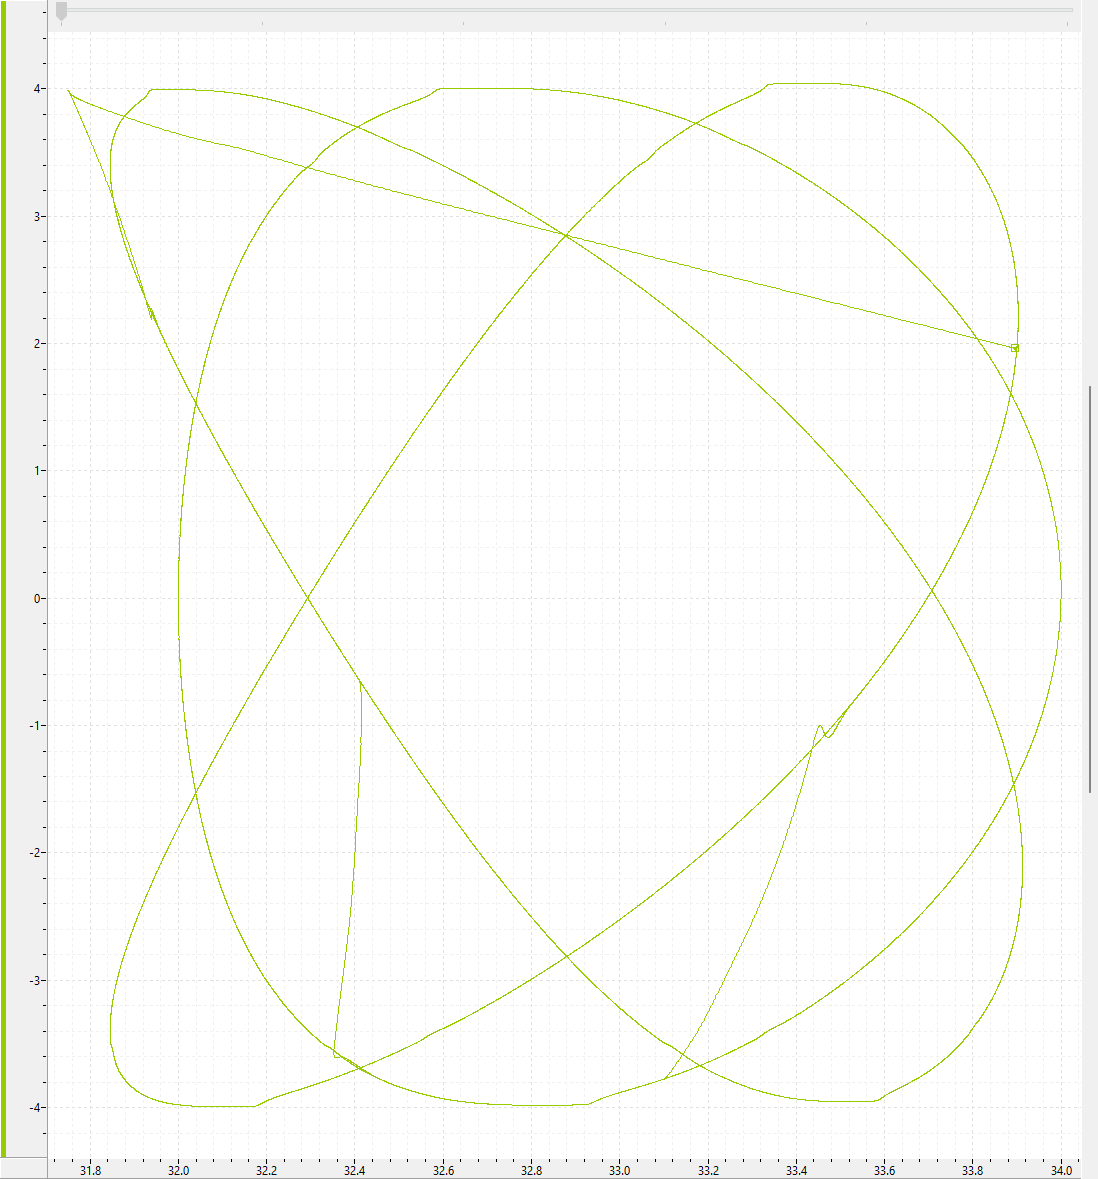
RMCTools Implementation
A RMCTools project that uses this math is shown below:
Find third point from two points and lengths.rmcproj (32.3 KB)
XY plotting can be very useful to view the resulting motion. Below is a plot with a varying phase between axis A and axis B. This was captured using the XY Plot defined in the project and running the ExampeMoves program.